PBHbounds
![]()
![]()
![]()
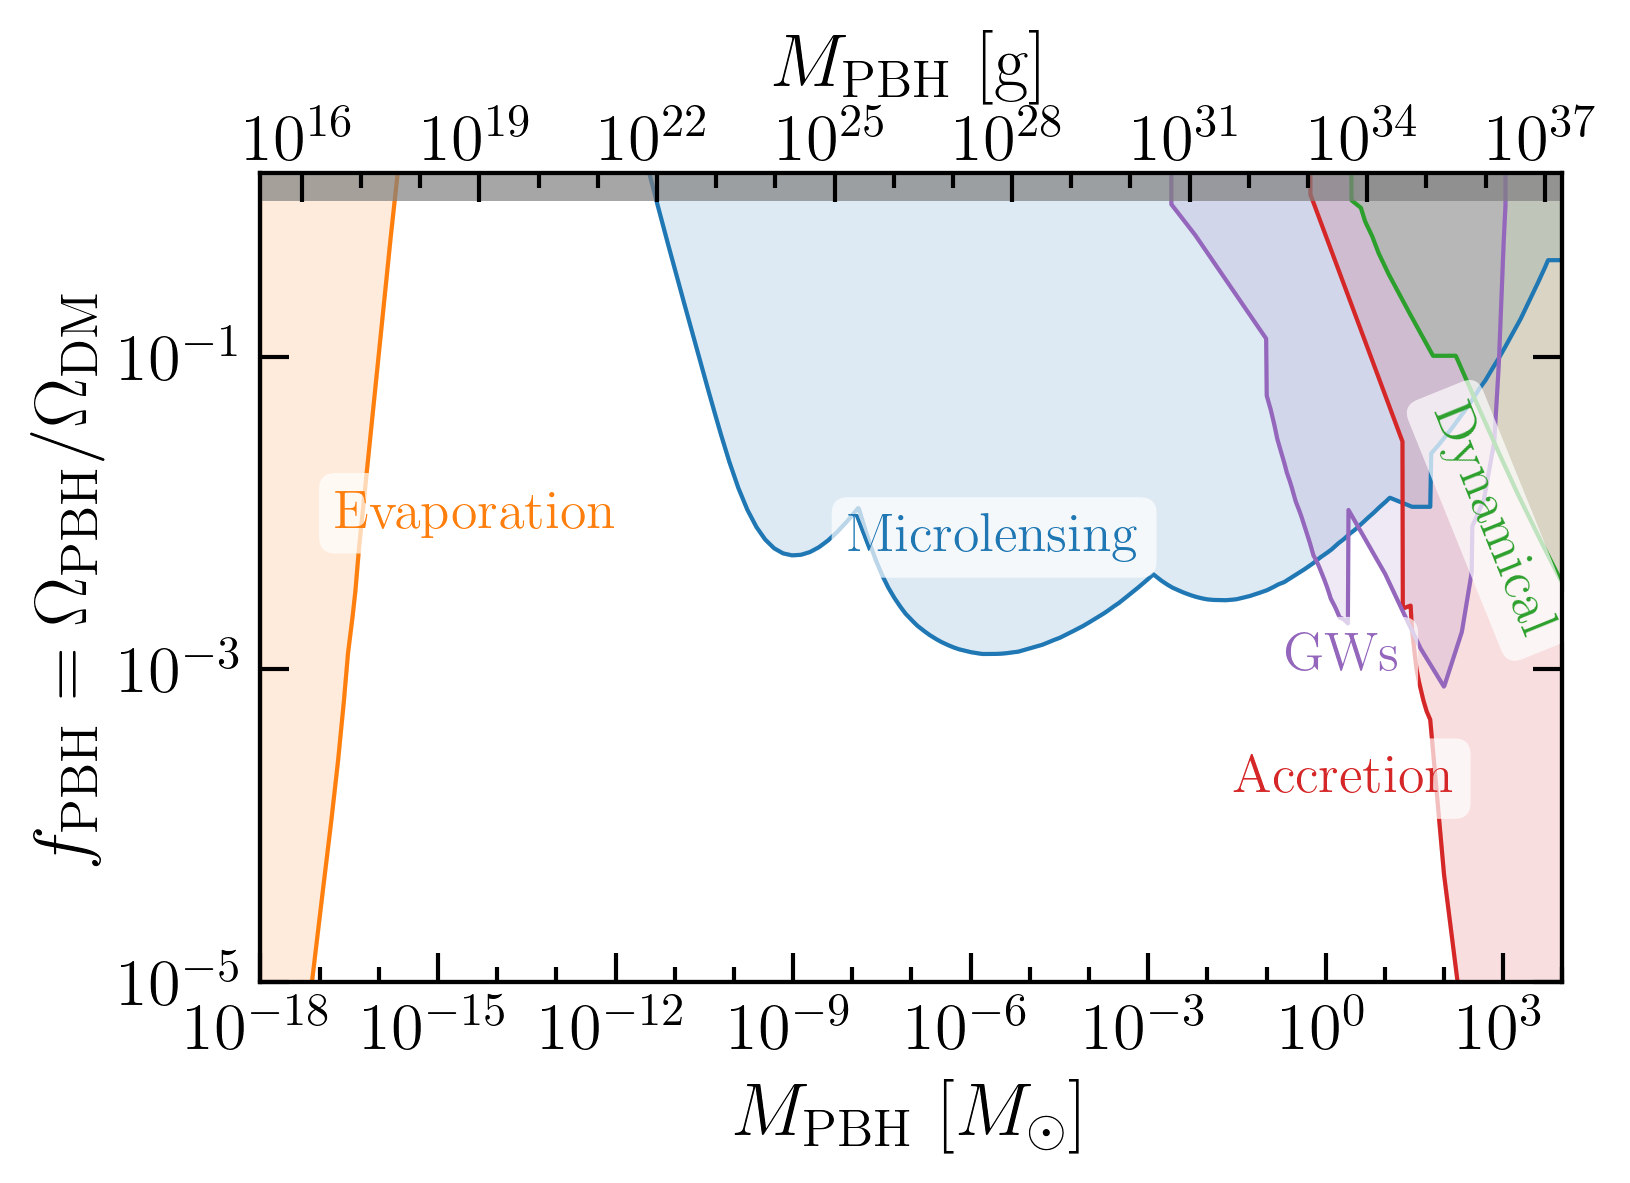
A collection of bounds on primordial black holes (PBHs) and code for plotting them.
Bounds
The list of available, tabulated bounds is in the bounds/ folder (see the readme there). The fact that I’ve included or omitted a particular bound shouldn’t be taken as an endorsement or otherwise. I’ll leave the user to exercise their own judgement when choosing which bounds are relevant. Note also that some of the bounds plotted above as dashed lines are projections.
Contributing
If you’d like to add a bound to the repo, there are a few options:
- Make the changes yourself:
- Add the new bound as a
.txtfile in the bounds/ folder. Each file should have two columns, corresponding to the PBH mass in Solar mass, and the constraint on the PBH fraction. Also include a comment at the top of the file giving a link to the source of the bound. - Update the bounds/README.md file with information about the new bound.
- Submit a pull request
- Add the new bound as a
- Create an issue here on the github repo, pointing to the paper/bound which is missing.
- Contact me directly at bradkav@gmail.com and let me know which bound you think should be added.
Plots
Some example plots summarising the bounds are in the plots/ folder.
You can see the basic functioning of the code in the example notebook here: PBHboundsNotebook.ipynb. There, you can add constraints one-by-one according to the boundIDs listed in the readme of the bounds/ folder. It’s also straightforward to adjust the line styles and text labels in this notebook view.
In practice, for a large number of bounds, it can be more sensible to provide a list of bounds. You can produce a plot with
python PlotPBHbounds.py -listfile LIST_FILE -outfile OUT_FILE
where LIST_FILE is a text file containing a list of bounds to be plotted (see listfiles/list_all.txt for an example) and OUT_FILE is the full filename of the image to be output (e.g. plots/PBHbounds.pdf). You can use the short flags -lf and -of for specifying the list file and output file.
A dark theme (with black background and white text) can be set using the flag --dark.
There are several preset scripts for plotting collected limits from Accretion, GWs, etc. There is also an ‘empty’ script if you want to plot from scratch using the tools.
The plot style and some of the bounds are inspired by arXiv:1801.00808.
Primordial Power Spectrum
Constraints on the primordial power spectrum can be plotted with
python PlotPSbounds.py
which is roughly inspired by plots from arXiv:1811.11158, arXiv:1812.00674 and arXiv:1909.01593.
Versions
Version 1.0 (12/11/2019): Release version. Created for the first GW4FP workshop (Amsterdam 2019).
A list of updates and recently added bounds can be found here: updates.md
Citation
Feel free to use the bounds and code for anything you like, but please link to the repo if you do and cite the DOI: 10.5281/zenodo.3538999.
An list of papers (probably incomplete) using the PBHbounds code can be found here: papers.md. Please also get in touch to let me know you’ve used the code. That way I can keep track! Thanks.